Using the Retail Agency Ranking Report
Last updated: July 5, 2025
You can use the Retail Agency Ranking Report to quickly see how much business your agency is placing from the Retail Agencies with which you do business
Applies to:
- Administrators
- Producers
Last Updated: February 2022
This article explains how you can access and use the Retail Agency Ranking Report to better understand your book of business and identify year on year trends that may affect your profitability.
You can use Retail Agency Ranking Report to answer the following questions:
- How much business am I placing with each Retail Agency?
- How does the amount of business I place with each Retail Agency compare to the prior year?
- What percentage of the business being placed with each Retail Agency is renewals rather than new business?
- What is my application to bind ratio for each Retail Agency?
You can find this report by going to the “Reports” tab in the side navbar, then going to “Production”, and then selecting “Retail Agency Ranking Report”
This report compares production totals from the current year to the prior, which is broken down into Gross Premium and Net Revenue amounts, and New Business and Renewals percentages based on specific time frames selected by a user.
- The default time period is the current calendar month
- This report can be filtered:
- by Time period on the UI using the “From” date, the “To” date, and by producer.
- By clicking Add Filters button to filter by:
- Producer
- Carrier
- Business Type
- Application Type
- Bound premium is calculated based upon the [Effective Date]
- All of the columns displayed on screen are sortable
- By clicking the Retail Agency name, you can access the overview tab of that Retail Agency in the CRM
The Retail Agency Ranking Report can be displayed on screen, downloaded as a PDF, or downloaded in a CSV format.
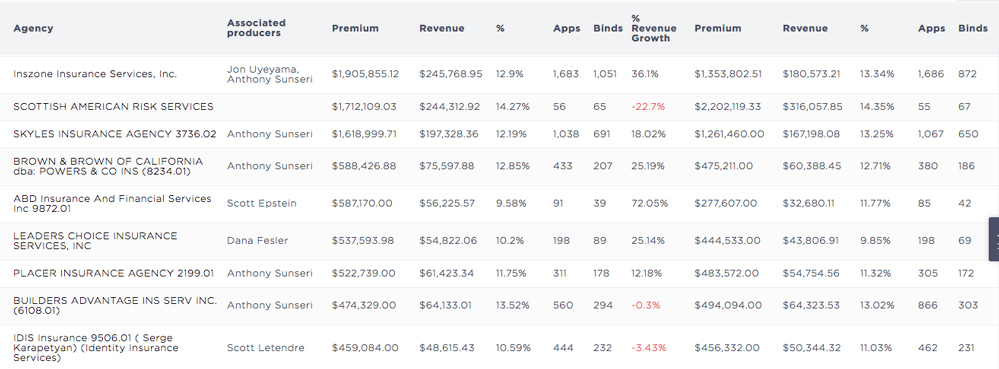
The columns in this report include:
- Retail Agency
- Associated Producer
- Premium - [Net Premium ($)]
- Revenue - [Gross Revenue ($)]
- Renewal % - [Renewal %]
- New Business % - [New Business (%)]
- Margin % - [-]
- Apps [# Applications]
- Binds [# Binds]
- % Revenue Growth - [YoY % Revenue Growth}
- PY Premium - [Net Premium ($)]
- PY Revenue - [Gross Revenue ($)]
- PY Renewal % - [Renewal %]
- PY New Business % - [New Business (%)]
- PY Margin % - [-]
- PY Apps [# Applications]
- PY Binds [# Binds]
Note: Margin is the percentage of Revenue against Premium
Keywords for Search:
- Agency report
- Retail agency report