Using the Geographic Production Report
Last updated: July 5, 2025
You can use the Geographic Production Report to quickly see the geographic distribution of policies bound by your agency
Applies to:
- Agency Owners
- Administrators
- Producers
- Account Assistants
This article explains how you can use the Geographic Production Report to look at the geographic distribution of policies bound by your agency.
You can use the Geographic Production Report to answer the following questions:
- How many policies does my agency bind in each state?
- How much premium does my agency bind in each state?
- Which states are my agency’s policies concentrated in?
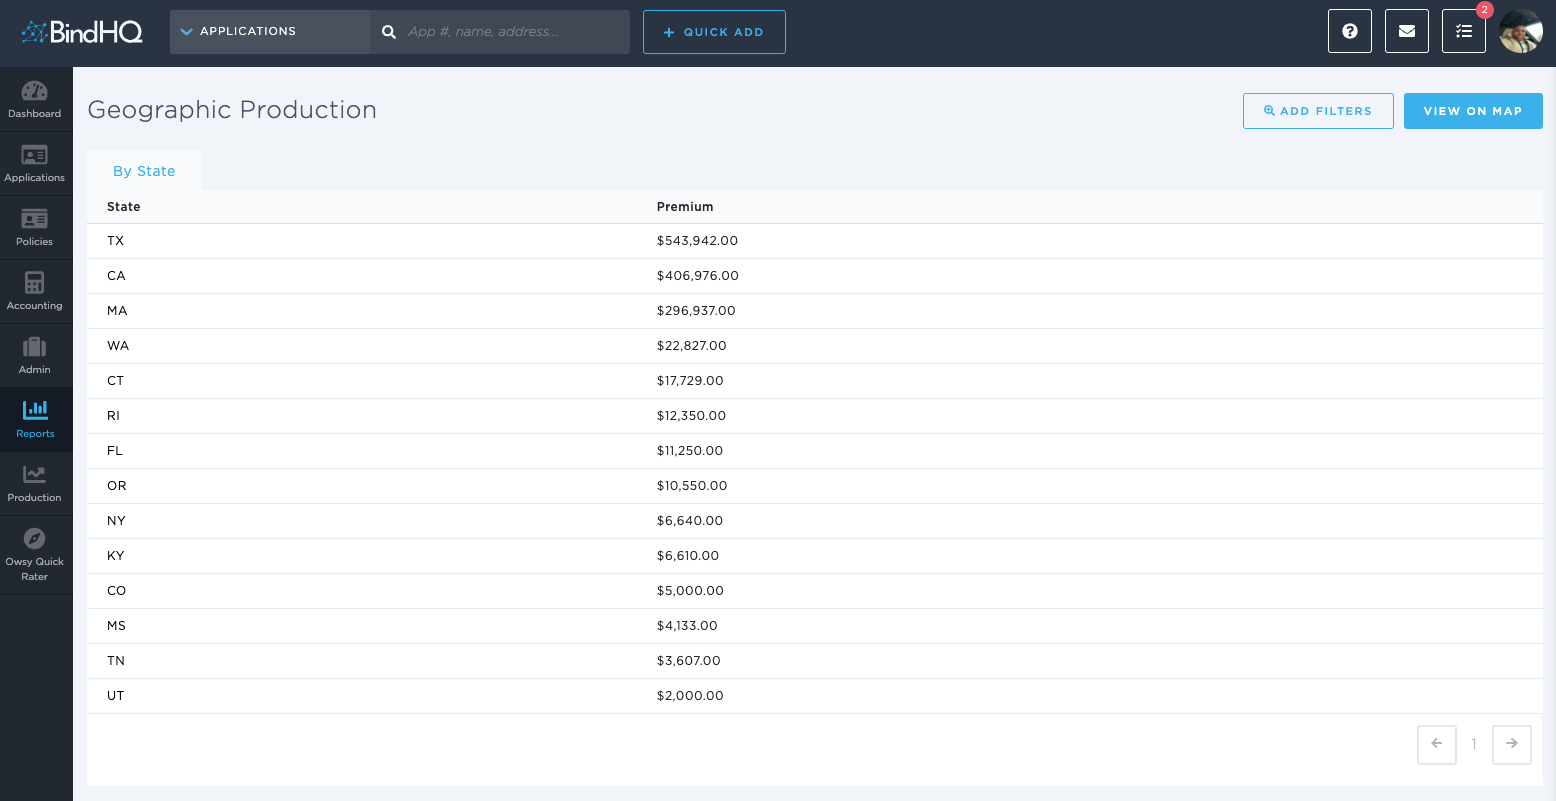
You can find this report by going to the “Reports” tab in the side navbar, then going to “Production”, and then selecting “Geographic Production Report.”
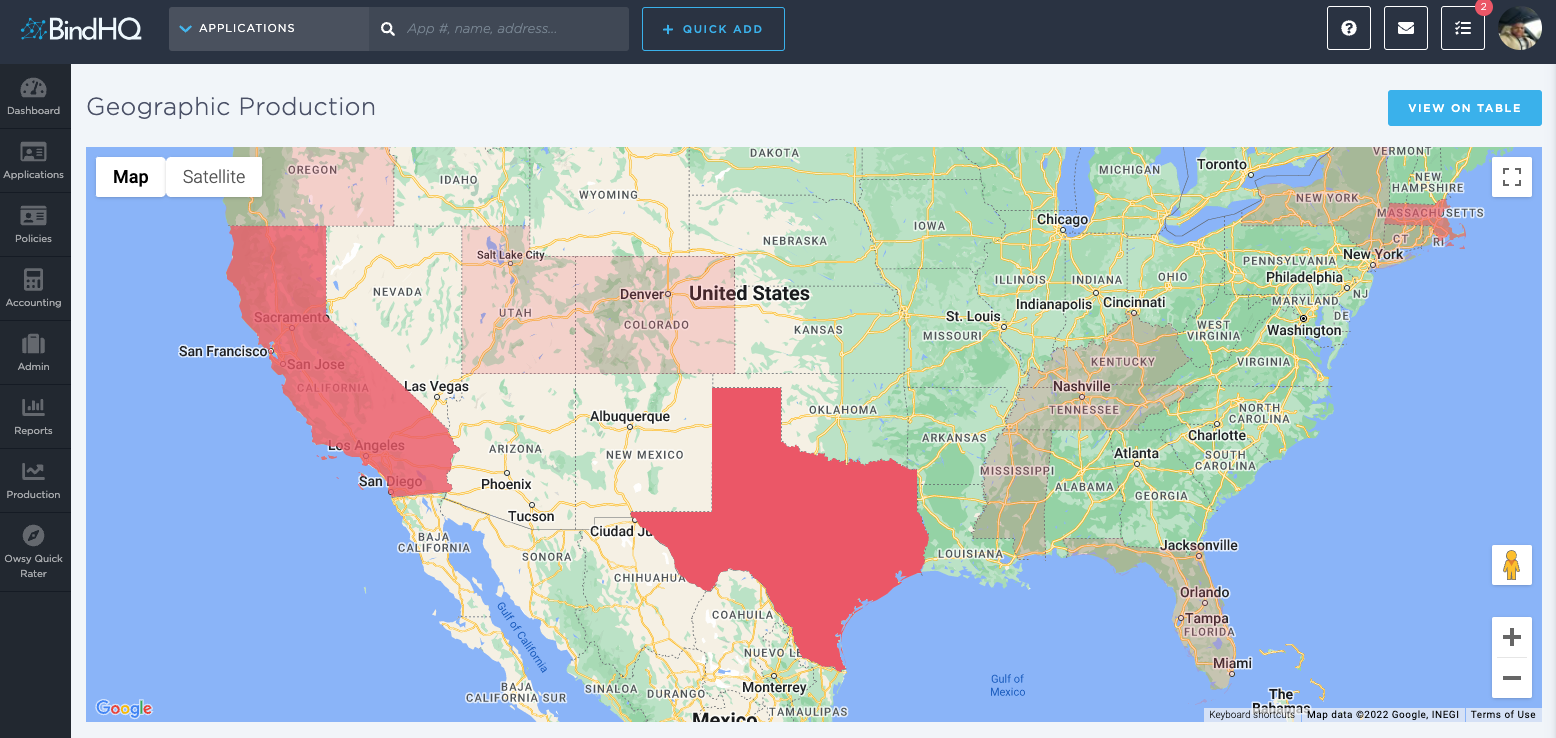
This report lists premium totals of the Insured mailing address (as recorded in BindHQ) by zip code and by state. You can see a visual representation of the premium density by state by clicking ‘View on Map.’
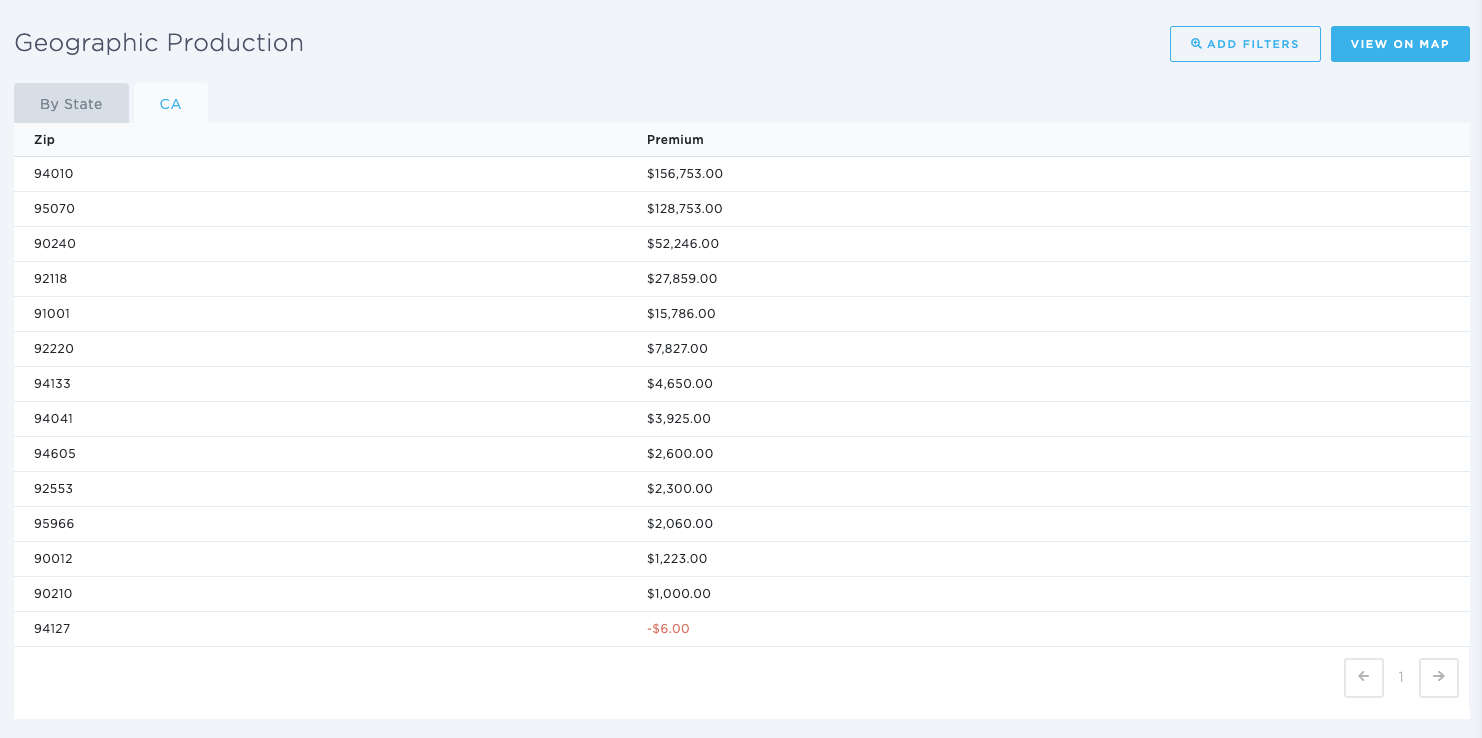
The report can be filtered by “From” date, “To” date, State, [Retail] Agency, and Market [Marketing Company].
When it is filtered by State, the report on the screen lists premium amounts by Zip Code. When it is filtered by Carrier, the report is filtered by Program.
The columns included in this report are:
State - [State]
Premium - [Gross Premium ($)]
Keywords for Search:
- Geographic production
- Geographic production report